By Shawn Walter, Data Scientist, AgStrata, LLC
It’s no big surprise that there’s a lot of variation between one lot and the next. For that matter, there’s plenty of variation within a given pen of cattle. Perhaps part of the art of buying feeder cattle is to be able to look at a set of cattle, add some information about origin, condition, breed types, etc., and make a projection about how those cattle will perform. Unfortunately, most cattle don’t come with a label that tells you anything about their genetic potential, past illnesses and exposure to diseases, or even how many homes they’ve had since they left their mamas.
As a result, we go with the averages, rules of thumb, SWAGS, etc. Call it what you want, but most “evaluations” of feeder cattle value include an assumption that they will perform about average and you hope that the good ones make up for the bad ones. If you feed enough of them, that works out. In the best-case scenario, there may be an adjustment for “quality” – adjusting the cost of gain estimate a few cents either way.
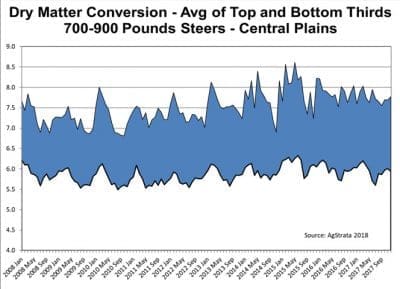
But how much adjustment is enough? The graph above shows the range in dry matter conversion between the average of the high and low one-third on 700- to 900-lb. steers in the Central Plains. This is not the full range – only the range between the average top and bottom one-third. The average difference over the past 10 years is 1.65 pounds of dry feed per pound of gain (5.85 versus 7.5).
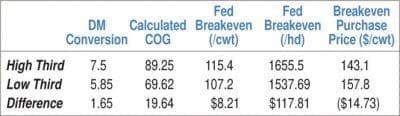
Extrapolating from conversions to cost of gain is pretty simple – multiply dry conversion by dry ration price per pound. Using this month’s Central Plains average ration price of $238/ton gives you a range in feed cost of gain from 69.6¢ to 89.25¢, or pretty close to 20¢ per pound of gain. That’s probably more of an adjustment than any one is making on breakeven projections.
Carrying that out to a fed breakeven (using a constant purchase price of $140/cwt) that’s a difference of $8.21/cwt or $117.81 per head on a 1,434-lb. out weight (February Central Plains data for 700- to 900-lb. steers). Perhaps a more appropriate way to look at that is the difference in the breakeven purchase price between the high and low performers, which is $14.73/cwt (see table below).
Even using the range of conversions within the middle one-third only, there’s a range of 6.22¢ to 6.75¢, which going through the same math, is a difference in profitability of almost $40/head or a $5/cwt difference in breakeven purchase price on an eight-weight steer.
Bottom line
I struggled as to whether this information was just “nice to know” or something that could make a difference to your bottom line. Five years ago, this would’ve probably just been interesting information, but as more feeders are being marketed with good genetic information through a growing list of programs sponsored by various breed associations and/or marketing programs, enough information is available on a growing population of feeder cattle to make a more informed pricing decision.
As this population grows, you have to assume that cattle without this information are more likely to be lower “true-value” feeder cattle and will carry a discount. If you feed enough cattle, you may believe you are safe to work off the averages – and probably are – but put this into a risk management perspective. If a feeder cattle futures trading strategy allowed you to cut $5/cwt off your average feeder cattle price, it would be considered a successful program. That’s the average breakeven purchase price difference between just the high and low ends of the middle one-third conversion group. That’s more than just “nice to know.”