![]()
Producers often experience price shocks due to discrepancies in supply and demand, which are rarely understood in real time. Usually only after the dust has settled can we look back and understand the causes.
In the last two decades, we have witnessed extreme examples with major price shocks in both directions. In 2022, wheat prices surged to $12.00 per bu., and fell back to $8.00 per bu., nearly as fast after Russia invaded Ukraine. End-users scrambled to secure supplies and speculators piled on.
On occasion, these commodity price spikes can be more long-lasting, affecting market participants for months or years. For example, a 2000’s commodities super-cycle, driven by the rise of Chinese manufacturing, culminated in a $143 barrel of oil in July 2008.
Closer to home, corn has found a seemingly permanent $3.00 per bu. price floor since the Energy Policy Act of 2005 federally mandated grain-based ethanol blending. Later, on the back of this newfound ethanol demand and severe drought, corn prices rose to $8.30 per bu., in the summer of 2012 and wouldn’t roll over for almost 18 months.
What causes massive price swings in commodities when other items we consume seem to move incrementally? Commodities are often the base materials upon which an economy is built; they are standardized and fungible with limited differentiation. These characteristics enable new parties (when incentivized) to enter the market to produce these goods and alleviate scarcity. In the wheat example above, U.S. prices increased to address the disruption caused by the Russia-Ukraine conflict, incentivizing more producers to sell their goods into a higher market. At the same time, end-users are forced to pay a higher price or seek an alternative.
Cattle are a nearly $100 billion industry responsible for one-fifth of U.S. agriculture’s total cash receipts. Cattle in the United States are standardized by grading and classes. Through this system, producers are paid premiums for characteristics such as Wagyu or Certified Angus animals. An entire schedule of price sliders and classifications differentiates calves and replacements. There are limited beef substitutes. As a result, when supply drops and price increases (as we have seen recently), the market attempts to exert downward pressure through factors outside the producer’s control.
Wholesale Choice beef prices have been on an upward trajectory for more than a decade, with prices $100/cwt. higher vs. ten years ago. Choice/Select premiums have also continued to increase over that period, even as Choice grading has increased as a percentage of production. The industry is producing more high-quality product, yet quality price premiums have continued to rise, in the opposite manner of most commodities.
This reflects a beneficial change in consumer tastes and higher demand for quality beef. Cash receipts are $25 billion higher vs. ten years ago. That extra cash has allowed packers to absorb the impact of a more costly beef animal, which in turn has pushed a higher cash price to feeders and ranchers.
In response to price incentives, beef imports have shot up while exports have fallen. The U.S. transitioned to a beef net importer in December 2022 and has not looked back. Through the third week of April, the U.S. imported a combined 516k metric tons of fresh and processed beef and exported 250k metric tons. Since the beginning of the year, the U.S. has been a net importer of beef by 266k metric tons; or about 586 million pounds. In comparison, beef production that week was 523.6 million pounds. Through the first 16 weeks of the year, net imports have added more than a week of production to consume. Feeder cattle markets have seen a similar reaction as year-to-date imports from Mexico have totaled more than 463k head vs. 404k head last year. This equates to an increase of 59k head year-over-year into U.S. feedyards.
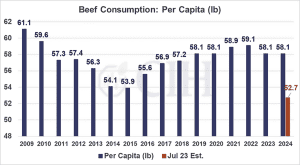
Back in July, the World Agricultural Supply and Demand Estimates reported a drop of 8.5 percent in consumption per capita – this would be lower than 2015 levels! In response to such a short supply, nearby live cattle futures increased from about $150 in January 2023 to a $187 high in September 2023. However, other factors came in to fill in the supply hole. Production today is estimated down only 2 percent vs. 9 nine percent last Summer, partially due to heavier weights and more cattle imports. Beef imports are up 12 percent vs. last summer’s estimates of only 1 percent. Bottom line, disappearance per capita is estimated to be unchanged year-over-year vs. the previous estimate of 8.5 percent lower. By December, nearby futures had fallen under $165 and have not recovered to previous highs yet.
This example illustrates the market’s mechanisms for addressing supply/demand imbalances in manners beyond domestic producers’ control.
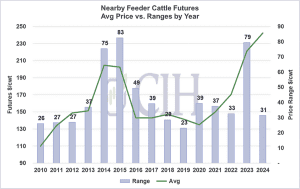
The industry is littered with examples of markets solving these imbalances and price swings as fundamentals adjust. In most years, feeder cattle futures trade in approximately $20-30 ranges. In 2014/2015 and 2023, prices experienced swings from $75 to $85.
What can a market participant do to protect themselves from extreme volatility and price shocks?
One tool is using the futures markets to hedge price risk. Many hedgers are familiar with futures trading, but are reluctant due to cost of potential margin calls. Alternatively, a hedger can use the options market for price protection with opportunity to participate in higher prices. Buying options involves an upfront premium cost, but tends to be more cash-flow friendly than futures alone.
Interestingly, when livestock markets rally, options strategies become more attractive since options tend to get cheaper as futures get more expensive. As livestock prices increase, volatility (the price of options) tends to decrease. The market may offer you a cheaper hedge for a more expensive product.
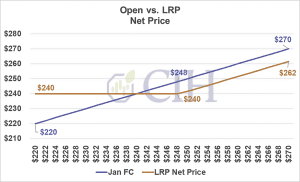
For example, during last year’s September market peak, January 2024 Feeder Cattle traded at $266/cwt., while volatility was at 10-year lows of 12.16 percent. During the covid lows, January feeders hit $127/cwt., and volatility increased to almost 20 percent (second highest). Essentially, the market is lowering the relative price of protecting feeder cattle through options while their price of the underlying animal is close to record highs. Live cattle contracts usually show the same effect, driving the cost of hedging lower as the contract’s value increases.
Livestock Risk Protection
Over the past few years, the federal government has also made significant improvements to its Livestock Risk Protection (LRP) program. LRP offers price risk coverage and similar protection to a put option. However, the government offers a subsidy for the LRP program making it almost always cheaper compared to a similar put option. In the example above, a $266 LRP would only cost $5.71/cwt. rather than $7.725/cwt. That equates to a savings of about $2/cwt., or $44 to protect an animal worth more than $2,100. One consideration of using LRP is these endorsements are binding once initiated and are less flexible than futures and options. Another is basis since LRP settles to the feeder cattle index while futures/options settle to futures. Below is an example of how LRP would set a floor on net price, as well as a comparison of LRP vs. a CME Put.
Market dynamics can and often do change quickly. Cash contracts, futures, options and LRP are viable tools to help offset risk for cattle producers and navigate turbulent times. Whether or not market participants implement each of these is a personal decision, but it is important to be aware of the tools available for cattle producers to take control of their bottom lines.
Market information offered by Commodity & Ingredient Hedging, LLC, a commodity trading advisor registered with the CFTC and a Member of NFA. Insurance services provided by CIH Insurance Services, LLC. The information contained in this publication is taken from sources believed to be reliable, but is not guaranteed by Commodity & Ingredient Hedging, LLC, nor any affiliates, as to accuracy or completeness, and is intended for purposes of information and education only. Nothing therein should be considered as a trading recommendation by Commodity & Ingredient Hedging, LLC. There is a risk of loss in futures and option trading. Past performance is not indicative of future results.
Issuance of insurance coverage is subject to underwriting review and approval. Coverage not available in all states. Please see the policy for the full terms, conditions and exclusions. CIH Insurance Services, LLC is an insurance agency licensed to sell certain insurance products and may receive compensation from insurance companies for such sales. Policy obligations are the sole responsibility of the issuing insurance company. Coverage scenarios are hypothetical and shown for illustrative purposes only. Coverage is dependent on the actual facts and circumstances giving rise to a claim. CIH is an equal opportunity employer and provider. © 2024 CIH. All rights reserved.